Simple service to track, chart and analyze your data metrics.
Send your data via the simple API and view the results in clear graphs. If you want to get fancy, we have features such as alarms, annotations and more.
Sign upVisualize data

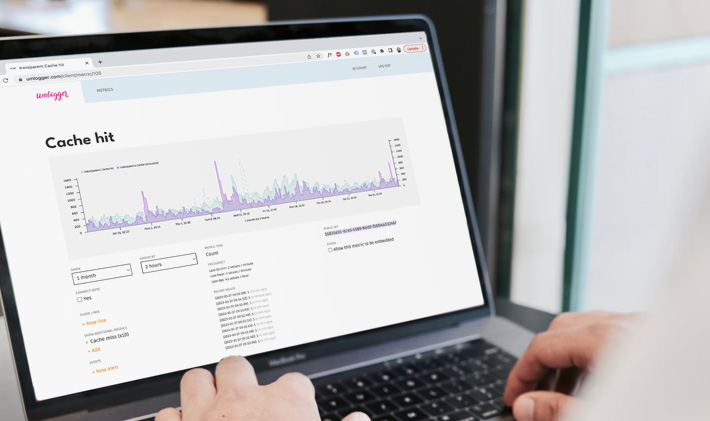
Each metric is presented in a clean and clear chart. Tweak time period and resolution to your convenience.
You can choose to track occurrence of events, or a changing value over time.
Alerts

Get notified when something changes for better or worse, with customised settings.
Did the conversion rate drop more than 10%? Trigger alert!
No data in the last hour? Trigger alert!
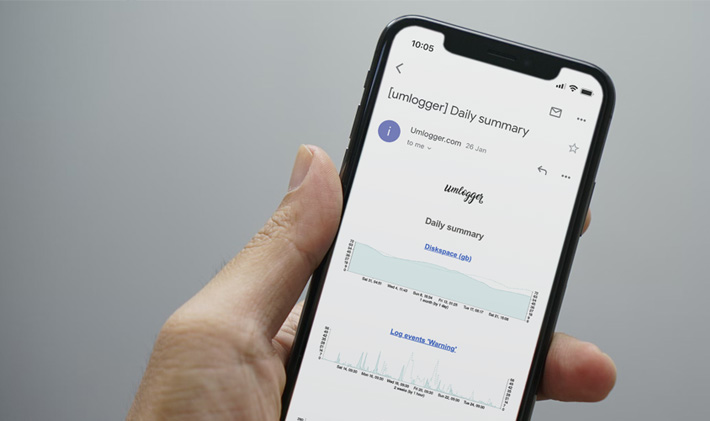
Email summaries

Once per day we send you a summary of the metrics in your account, helping you view the current status without having to log in every day.
Showcases
Software performance
Keep track of cronjob execution times, deployments, response times for third party APIs, and more. This will help to give you a good overview on the status of your application.
Combine with alerts to be notified if something goes wrong.
 APP.CRONJOB #1 EXEC TIME (S) Showing 1 day, grouped by 15 min
Server stats
Track database size, server CPU load, memory usage and more to keep an eye on the health of your server.
Setup a custom dashboard to monitor the metrics or just be reassured by the daily email digest.
 SERVER.MEM_USAGE Showing 2 weeks, grouped by 2 hours
Security
Monitor long term trends in number of blocked IP-addresses, access control (successful logins vs failed logins), requests on missing pages (404s), and more to get a birds eye view on the security situation and facilitate risk assessment.
 BLOCKED IPs + 404-HITS Showing 1 month, grouped by 12 hours
Simple API
Sending data to umlogger is easy. We have code snippets ready for you in many languages.
cURLcurl -d "metric_name=response_time&value=21&apikey={apikey}" https://rec.umlogger.com/p
HTML<img src="https://rec.umlogger.com/p?metric_pubkey={pubkey}&value=1"/>
Javascript, PHP, Go, and more...View all code samples.
Start for free
It's easy to get started. You can try out for free and after 30 days the basic plan starts at only 1$ per month. See plan details here or reach out to us for more details.
